
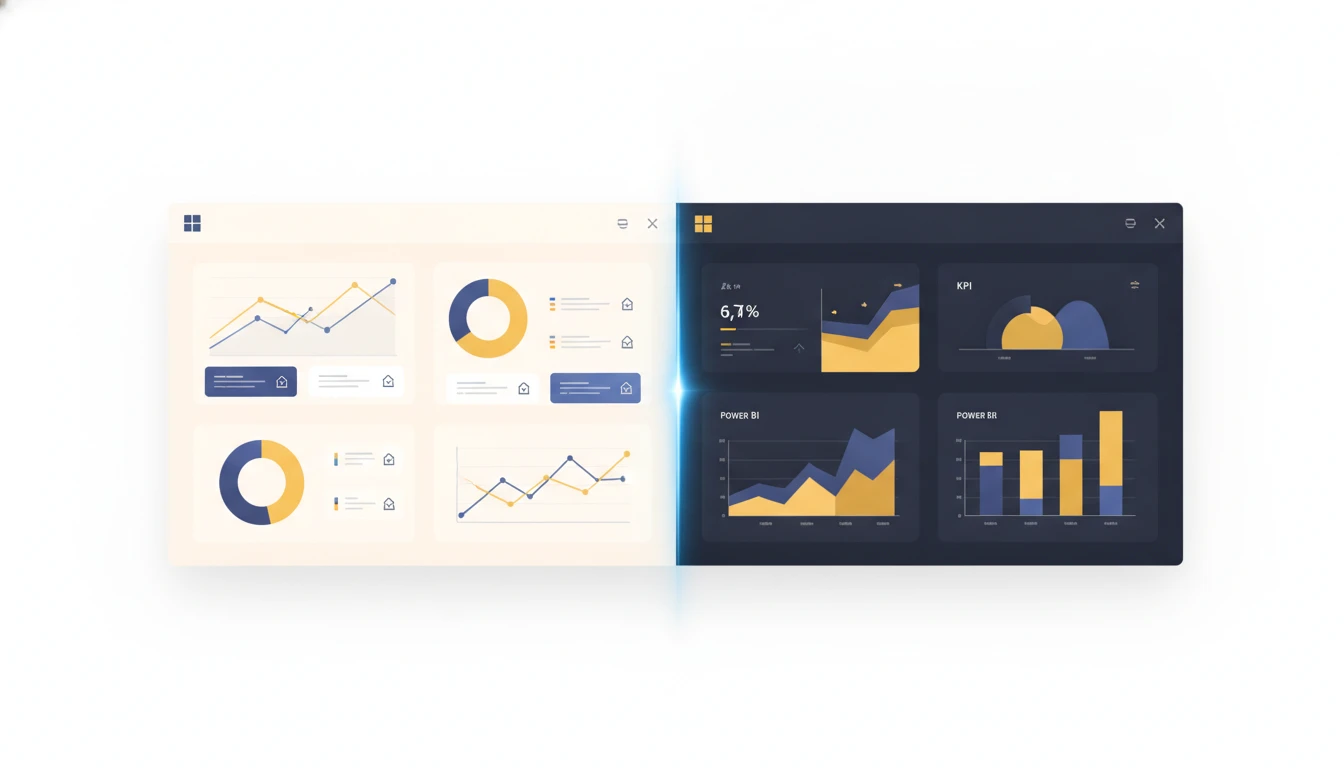
We install dashboards every week. Marketing reports for ecommerce clients, ops dashboards for service businesses, CFO views for SaaS founders. The two tools we reach for most are Looker Studio and Power BI, and every new project starts with the same question from the client: "Which one should we use?"
The honest answer is annoying. It depends on three things they have not told you yet. So this post is the version of the conversation we wish we could send before the first call. Real numbers, real pricing as of June 2026, and the decision matrix we actually use internally when we are scoping looker studio vs power bi for a new build.
If you want us to skip the comparison and just build the dashboard, our data analytics consulting services page has the playbook. If you are wiring this into an automation stack, our workflow automation builds live in the same repo.
TL;DR
- Looker Studio wins for marketing dashboards, Google-stack clients, agency reporting, and any project where "share a link, no seat needed" matters more than modeling depth.
- Power BI wins for finance and ops dashboards, Microsoft 365 shops, regulated industries that need row-level security, and any team with a serious data model behind the dashboard.
- Pricing in 2026: Looker Studio free, Pro at $9 per user per project per month. Power BI Pro at $14 per user per month, Premium Per User at $24, Premium capacity from ~$5,000 per month.
- The migration trap: switching tools without first fixing your data warehouse situation almost always ends in a rollback. The dashboard is not the problem.
The 90-second framework
Before we get into features, this is how we triage looker studio vs power bi on the first scoping call. Four questions, one answer.
- Where does your data live today? Mostly Google products (GA4, Google Ads, Sheets, BigQuery) lean Looker. Mostly Microsoft (Dynamics, SQL Server, Excel, Fabric) lean Power BI. Mixed or warehouse-first (Snowflake, Redshift) flips to whichever tool your team already knows.
- Who needs to look at it? Five-plus external clients viewing dashboards? Looker Studio - link sharing is free. Internal team of licensed users in a Microsoft tenant? Power BI is already paid for.
- How complex is the model? Sum, average, count, filters by date and source - either tool works fine. Joins across 12 tables, time-intelligence, row-level security, what-if parameters - Power BI. Stop debating.
- What is the failure mode you are most afraid of? "Nobody opens it" - Looker Studio, lower friction. "CFO finds a number that does not match the GL" - Power BI, you need DAX and a proper model.
If three of four point the same direction, that is your answer. If they split, default to whatever your team already knows. The best BI tool is the one your team will actually maintain.
Pricing in 2026, with the gotchas
Public pricing is half the story. Here is what actually shows up on the invoice.
Looker Studio
| Plan | Price | What you get |
|---|---|---|
| Free | $0 | Unlimited reports, all 23 native Google connectors, partner connectors (some paid), public link sharing |
| Pro | $9 / user / project / month | Team workspaces, content access controls, Google Cloud support SLA |
Hidden costs:
- Partner connectors like Facebook Ads, LinkedIn Ads, TikTok Ads cost $10 to $40 per month each (Supermetrics, Power My Analytics, Coupler.io). Budget $50 to $150 per month for a real marketing dashboard.
- BigQuery queries if you use BigQuery as your source. Most agency-scale dashboards stay under $20 per month, but a poorly-written report scanning a 100 GB table on every view will surprise you.
Power BI
| Plan | Price | What you get |
|---|---|---|
| Free (Desktop) | $0 | Build reports locally, no sharing |
| Pro | $14 / user / month | Publish to Power BI Service, share with other Pro users |
| Premium Per User | $24 / user / month | All Pro features plus AI insights, paginated reports, larger model sizes |
| Premium per Capacity | ~$5,000 / month and up | Dedicated capacity, share with free users in your org |
Hidden costs:
- Viewer seats. Every consumer needs a Pro license ($14 per month) unless you are on Premium capacity. A 50-seat rollout is $8,400 per year before you write a single measure.
- Microsoft Fabric. The new wrapper that bundles Power BI with warehouse and pipeline tools. Capacity-based pricing, easy to overspend if you skip the cost-controls config in the first month.
Where each tool genuinely beats the other
Both vendors will tell you their tool does everything. That is true and also useless. Here are the calls we make in real client work.
Looker Studio is the right call when
- You are an agency reporting to multiple external clients. Free, link-shared, white-label-friendly templates. We have one Looker Studio template that gets duplicated for 30+ clients monthly.
- The source of truth is Google. GA4, Google Ads, Search Console, YouTube, BigQuery. Native connectors, no row caps, no auth dance.
- Speed-to-dashboard matters more than depth. First draft in a meeting, polish it in two hours, send it tomorrow.
- Your stakeholders will not install a desktop app. Browser-only, no friction.
- You want a public-facing report. Embeddable, password-optional, shareable URL.
Power BI is the right call when
- The audience is finance, ops, or executives in a Microsoft shop. They already have Pro licenses. The integration with Teams, SharePoint, and Excel is genuinely better.
- You need a semantic model. DAX measures, relationships, row-level security, time-intelligence built in. Looker Studio can fake this with blended sources, but it will frustrate you by month three.
- The dataset is enterprise-scale and local. Import mode with VertiPaq compression handles 100M+ rows on a laptop. Looker Studio cannot match this without a warehouse behind it.
- Compliance and governance are non-negotiable. Sensitivity labels, Microsoft Purview integration, mature audit logs. Looker Studio Pro is improving here but is behind.
- You will pay for an analyst to maintain it. DAX has a real learning curve. If nobody on the team will own it, the dashboard rots.
The data source comparison nobody publishes honestly
Most comparison posts list connector counts as if all connectors are created equal. They are not. Here is the version that matters.
Native, well-maintained, free connectors
- Looker Studio: GA4, Google Ads, Google Sheets, BigQuery, Search Console, YouTube, Campaign Manager 360, Display & Video 360, Looker (the enterprise product), CSV upload, MySQL, PostgreSQL, JSON over HTTP.
- Power BI: SQL Server, Azure SQL, Azure Synapse, Microsoft Fabric, Excel, SharePoint, OneDrive, Dynamics 365, Dataverse, plus 100+ premium connectors for everything from Salesforce to MongoDB.
Paid third-party connectors you will likely need
- Looker Studio: Facebook Ads, LinkedIn Ads, TikTok Ads, HubSpot, Shopify, Mailchimp, Stripe (via Supermetrics or Coupler.io, $40 to $150 per month).
- Power BI: Most of the above ship as native connectors, no third-party tax. This is a real Power BI advantage.
The takeaway: if your marketing stack is heavy on non-Google ad platforms, Power BI saves you $50 to $200 per month in connector fees. If your stack is BigQuery and GA4, Looker Studio saves you 12 viewer licenses you would otherwise pay for.
The migration trap
We get this email at least twice a month: "We are on Power BI but want to switch to Looker Studio to save money." It almost never works. Here is why.
A BI tool migration is three migrations stacked on top of each other:
- Rebuild every measure. DAX measures become calculated fields. Not a 1:1 translation. Time-intelligence patterns (SAMEPERIODLASTYEAR, TOTALYTD) need to be rewritten as date offset calcs. Plan 1 to 2 hours per non-trivial measure.
- Retrain every user. The interface, filtering model, sharing model are all different. Plan 4 to 8 hours of office hours over the first month.
- Re-establish trust. Stakeholders compare the new numbers to the old. They will find a variance (there is always a variance). You will spend two weeks proving the old number was wrong, the new one is right, or both are technically correct but methodologically different.
The dashboard is the visible part. The data model behind it is the actual product. If the model is sound, switching tools is a project. If the model is rotten, switching tools just hides the rot for six months before it breaks louder.
What we install, by client type
Our actual playbook, anonymized:
- Ecommerce brand on Shopify, $5M to $30M annual revenue: Looker Studio with Shopify connector via Coupler.io, GA4, Klaviyo via Supermetrics. Single dashboard, three tabs (acquisition, retention, product), 4-hour build. 95 percent of these clients.
- B2B SaaS, Series A to B: Power BI on top of Snowflake or BigQuery. Custom semantic model with revenue, cohort, churn, expansion measures. 2 to 4 week build. The CFO is the primary user; Looker Studio's lack of a real model is a dealbreaker.
- Agency reselling marketing dashboards: Looker Studio templated across 10 to 50 clients. One template, parameterized data source. White-labeled via white-label automation services when the agency wants the full done-for-you stack.
- Healthcare or financial services: Power BI, no exception. Row-level security, sensitivity labels, and Microsoft Purview integration are not optional.
- GoHighLevel agency reporting on client pipelines: Looker Studio pulling from GHL via a custom n8n workflow into BigQuery. The dashboard is free; the pipeline is where the money goes. We document this kind of build in our GoHighLevel automation work.
Feature gaps worth knowing
A few honest weak points on each side.
Looker Studio still struggles with:
- Cross-filtering in a way that does not feel janky on complex dashboards.
- Calculated fields across blended sources (workable, but the syntax is annoying).
- Performance on Sheets-based data above 50,000 rows.
- Mobile rendering of complex layouts.
Power BI still struggles with:
- Mac users. Power BI Desktop is Windows-only. Mac users have to use Power BI Service in the browser, which is missing roughly 30 percent of Desktop's features.
- External sharing. Sharing a dashboard with a client who is not in your tenant is technically possible but politically annoying every time.
- Initial learning curve. DAX is powerful and unforgiving.
- The Fabric pricing model, which is on its third iteration in 18 months.
When the question is wrong
The real question is rarely "Looker Studio or Power BI". The real question is usually one of:
- "How do I get my team to look at the dashboard?" - tool choice is secondary, distribution and ritual are primary.
- "Why do my numbers not match between tools?" - data model issue, not BI tool issue.
- "Can I afford to keep paying for Power BI?" - audit the viewer-seat sprawl, then decide.
- "Can my marketing manager build this?" - if yes, Looker Studio. If no, hire help and pick whatever your help knows.
Most of the time, the BI tool is the cheapest line item in the stack. Spending three months migrating to save $200 a month on licenses is a category error.
Buildberg's actual default
For a brand-new client with no existing BI tool and no strong preference, we default to Looker Studio on top of BigQuery. The reasoning:
- The BigQuery free tier handles the first $300 of queries.
- Looker Studio is free for everyone who needs to view it.
- The data model lives in BigQuery (in dbt or SQL views), so it is portable to any BI tool later.
- If the client outgrows Looker Studio, we migrate the dashboard to Power BI in two weeks without touching the model.
The lesson buried in that default: own the model, rent the tool. The model is the asset. The BI tool is the renter. Make the model good and the rest is replaceable.
Final call
If you came here trying to decide looker studio vs power bi for one specific project, the four-question framework at the top is the answer. If you came here because you are about to scope a 6-figure dashboarding project and your gut is telling you the existing tool is not the problem, your gut is right. Fix the model first.
If you want a second opinion on the build before you sign the SOW, our data analytics consulting team does paid scoping calls. We have done both migrations, in both directions, and we will tell you the truth even when it is "stay where you are".
The dashboard is not the goal. The decision the dashboard drives is the goal. Pick the tool that makes that decision faster to make.