
Most "best business intelligence tools" lists read like a vendor parade. Ten logos, ten paragraphs of marketing copy, a star rating, and zero help when you are the one who has to pick, pay for, and actually run the thing.
We build reporting systems for agencies and SaaS companies, so we see the after-picture: the tool that got bought, half-configured, and then quietly abandoned because nobody warned the team about the work underneath it. This guide is the version we wish more people published.
TL;DR:
- The best business intelligence tools in 2026 are Power BI, Tableau, Looker, Looker Studio, Metabase, and ThoughtSpot - but "best" depends entirely on your data stack and team.
- The tool is the cheap part. The data modeling underneath it is what decides whether the dashboards are trusted.
- Power BI wins on price for Microsoft shops. Looker Studio wins on free. Metabase wins on self-serve for small teams. Looker and Tableau win on scale and governance.
- Budget for implementation labor, not just seats. A $2,000/month license can hide $30,000 of setup.
What actually makes a BI tool "best"
Before the list, here is the honest scorecard. A business intelligence tool is only as good as how it does on these five things:
| Factor | Why it decides the winner |
|---|---|
| Data connections | If it cannot reach your warehouse and CRM cleanly, nothing else matters |
| Modeling layer | Governed metrics stop the "which number is right?" fights |
| Self-serve usability | If only one analyst can build reports, adoption dies |
Everything else - AI copilots, mobile apps, fancy chart types - is a tiebreaker, not a decision-maker. Keep that in mind as the marketing gets loud.
The best business intelligence tools in 2026
Microsoft Power BI
The default for any team already living in Microsoft 365, Azure, or Dynamics. Power BI Pro is roughly $14 per user per month, and Premium Per User is around $20 - which makes it the cheapest serious BI platform for most mid-market teams.
Best for: Microsoft-stack companies that want strong dashboards without a five-figure contract.
Watch out for: DAX, its formula language, has a real learning curve, and governance gets messy fast once everyone starts publishing their own reports.
Tableau
Still the gold standard for visual data exploration. If your analysts want to slice, drill, and discover rather than just view pre-built dashboards, Tableau is hard to beat. Tableau Creator runs about $75 per user per month billed annually, with Viewer seats around $15.
Best for: Data-mature teams that live inside their analytics and value visualization depth.
Watch out for: Cost scales quickly. A 50-user rollout lands in the $25,000 to $40,000 per year range.
Looker
Google's enterprise BI platform, built around LookML - a centralized semantic layer that forces every metric to have one agreed definition. That governance is the whole point. Looker is contract-only, typically $3,000 to $5,000+ per month for mid-market.
Best for: Organizations on BigQuery or Snowflake that need governed, consistent metrics across many teams.
Watch out for: No transparent pricing, and LookML modeling is a genuine engineering project. This is not a plug-and-play tool.
Looker Studio (formerly Google Data Studio)
The free option that punches above its price. It connects natively to Google Analytics, Google Ads, BigQuery, and Sheets, plus 800+ community connectors, and builds shareable dashboards in minutes.
Best for: Marketing reporting and any team that wants clean dashboards without a budget line. We compared it head to head with Power BI in our Looker Studio vs Power BI breakdown.
Watch out for: It struggles with large datasets and complex modeling. Great for reporting, weak for heavy analysis.
Metabase
The self-serve favorite for smaller teams and startups. Open source, quick to deploy, and genuinely usable by non-analysts asking questions in plain language.
Best for: Lean teams that want answers fast without hiring a BI specialist.
Watch out for: It is not built for enterprise governance or huge, gnarly data models.
ThoughtSpot
The search-and-AI-native option. Users type questions in natural language and get charts back, no drag-and-drop required. In 2026 this "ask your data a question" pattern is the direction the whole category is moving.
Best for: Business users who want answers without learning a BI tool at all.
Watch out for: It rewards clean, well-modeled data even more than the others. Garbage in, confident-but-wrong answers out.
Honorable mentions
Sisense (embedded analytics for SaaS products), Domo (all-in-one cloud BI), Qlik Sense (associative data exploration), and Zoho Analytics (affordable for Zoho-stack SMBs) all earn a place on the shortlist depending on your stack.
The part every BI listicle skips: the data layer
Here is the uncomfortable truth. None of these tools fix bad data. They render it.
A BI tool is a window. If the room behind it is a mess - three systems that disagree on what "active customer" means, a CRM full of duplicates, event data with no schema - then the prettiest dashboard in the world will just show that mess faster.
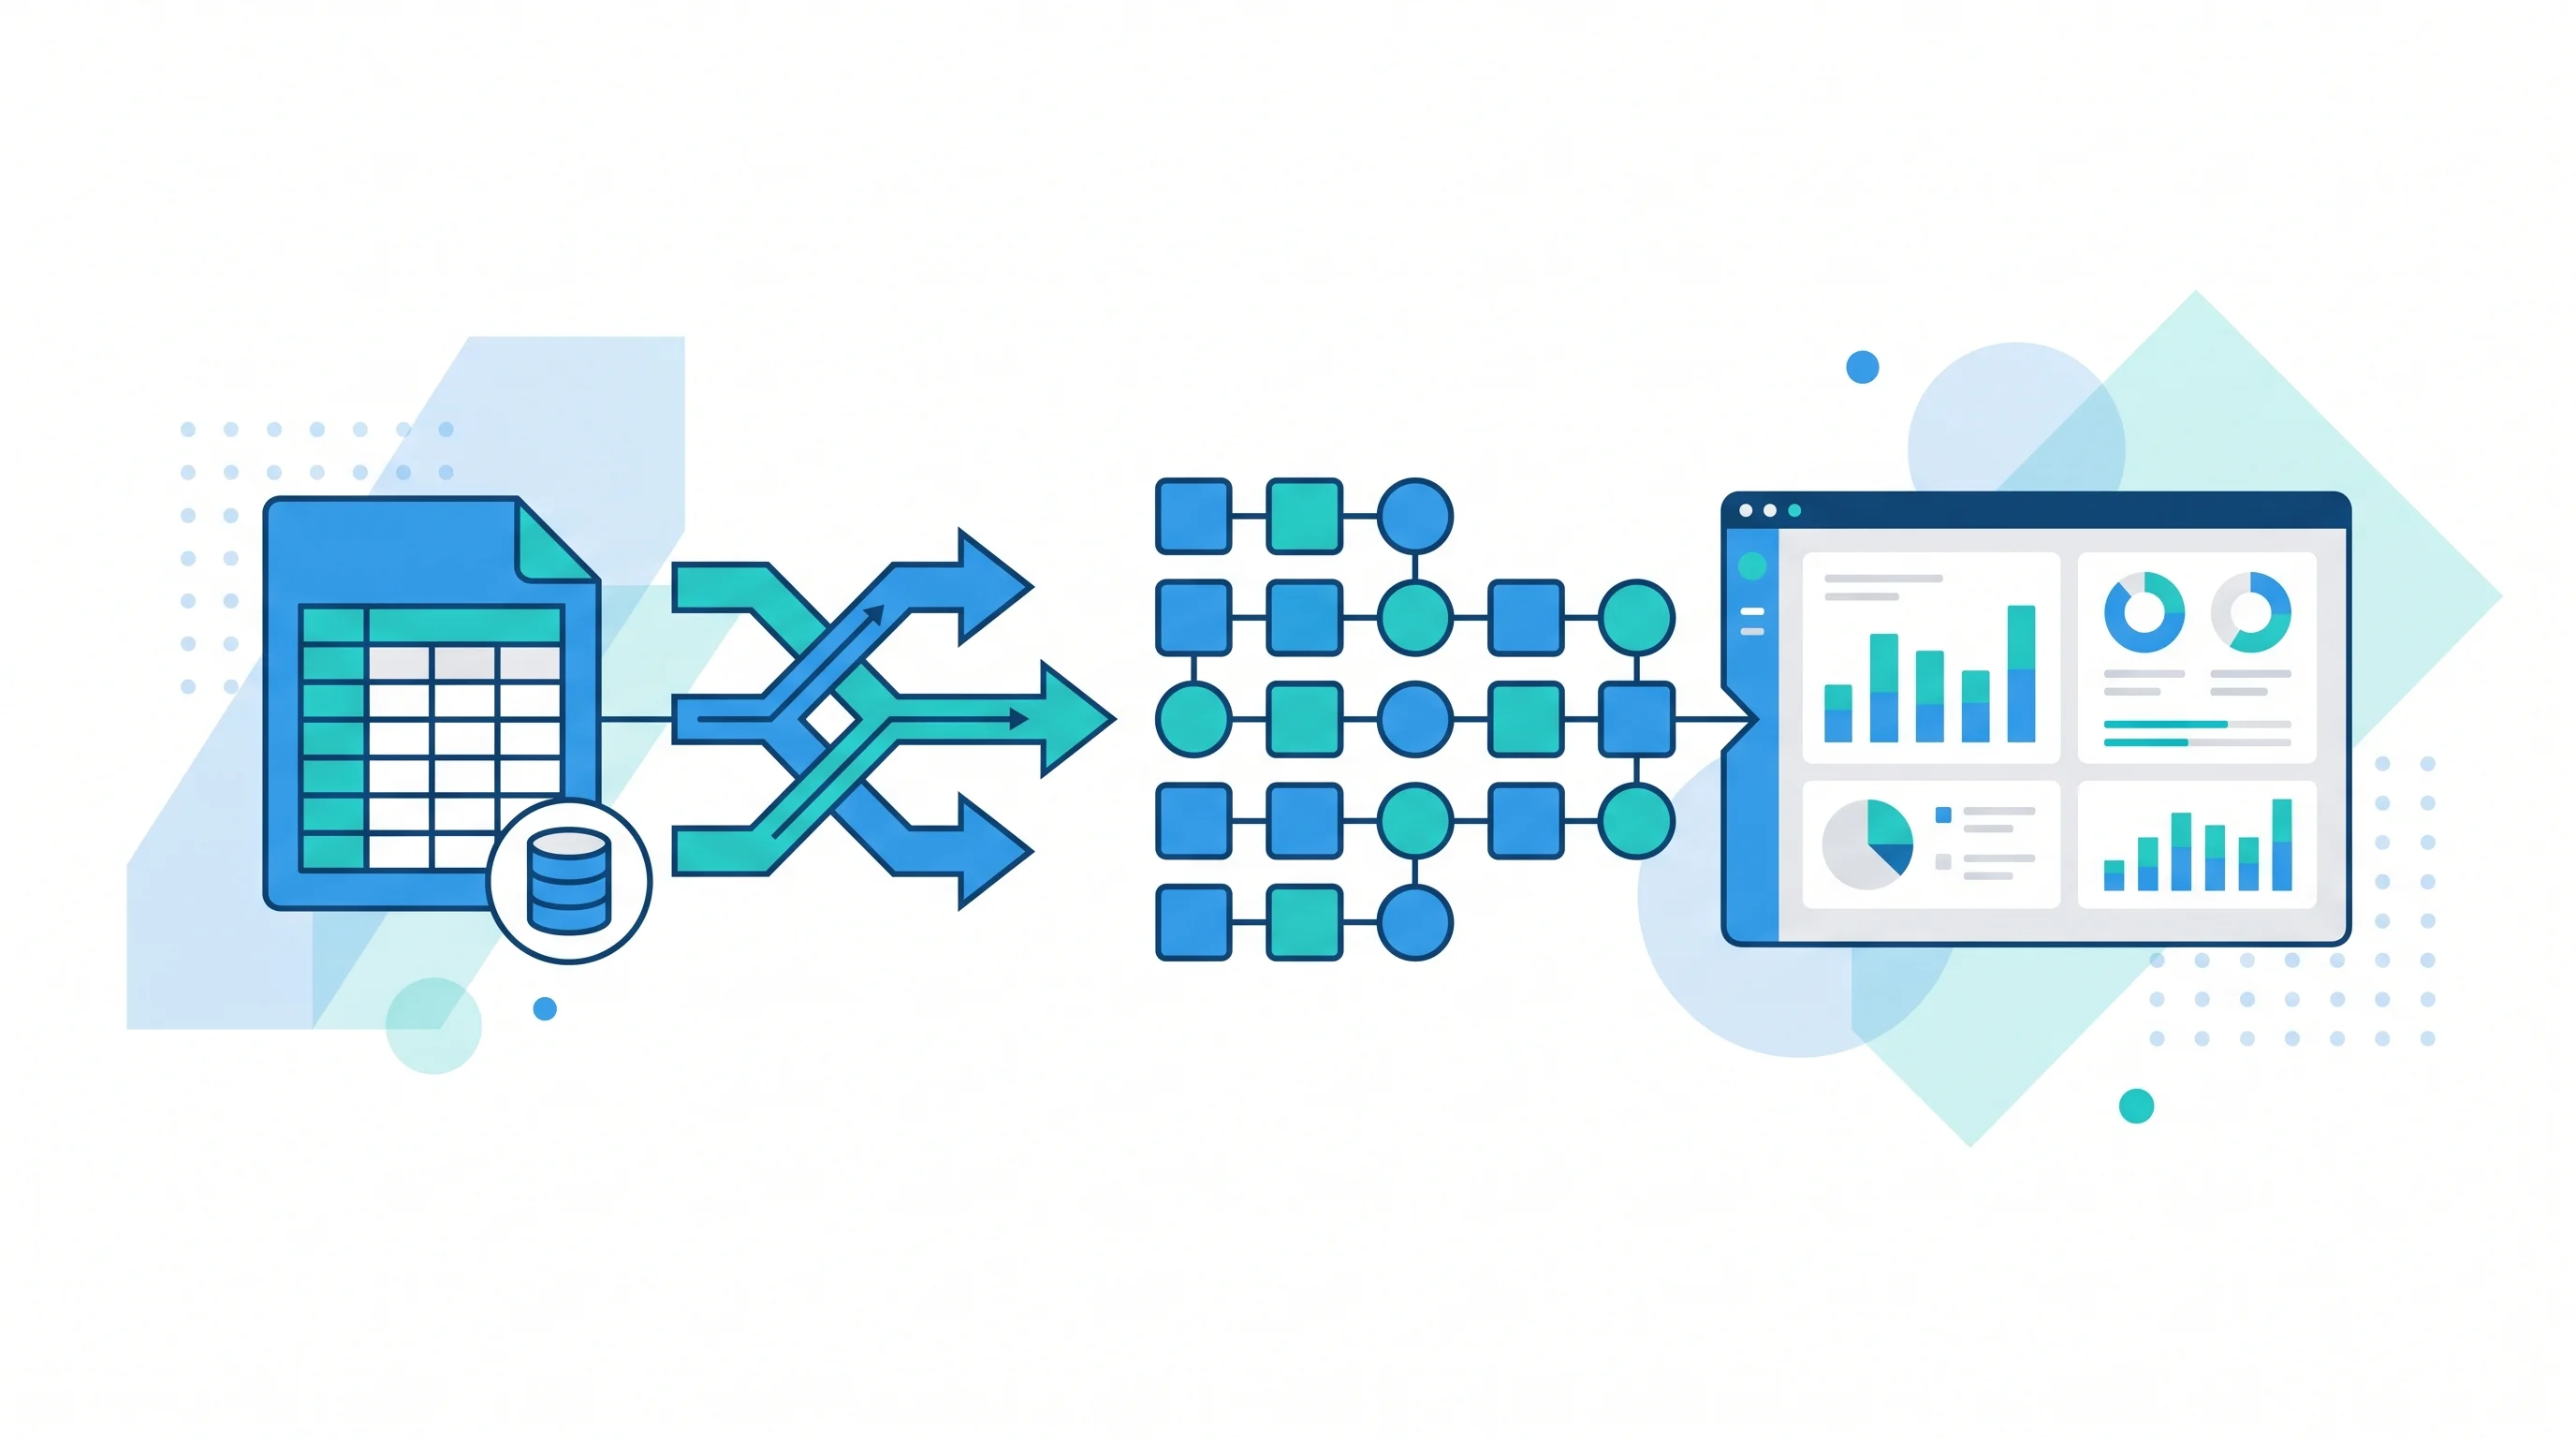
This is why so many BI rollouts stall. The license gets bought, the tool gets connected, and then everyone discovers the real work: extracting data from every source, loading it into a warehouse, and modeling it into clean, agreed-upon metrics. That pipeline work is what separates dashboards people trust from dashboards people ignore.
Getting that pipeline right is exactly the kind of project our data analytics and reporting service exists for - warehouse setup, ETL, and the metric modeling that makes any BI tool actually work. And because most of that extract-and-load work runs on schedules and triggers, teams increasingly wire it up with workflow automation pipelines rather than manual exports.
The honest cost breakdown for mid-market
The sticker price is the smallest number. Here is what a realistic 50-user deployment actually costs per year (list pricing as of mid-2026 - always confirm on the vendor's site):
| Tool | Licenses (approx/yr) | Real hidden cost |
|---|---|---|
| Power BI | $6,000 - $12,000 | DAX + governance setup |
| Tableau | $25,000 - $40,000 | Training + server admin |
| Looker | $36,000 - $60,000 | LookML modeling project |
Notice the pattern: the cheaper the license, the more the hidden cost hides in your own team's time. Looker Studio is free, but someone still has to build and maintain every data source behind it.
Add implementation on top. A properly modeled BI setup - clean warehouse, defined metrics, tested dashboards - is typically a $15,000 to $40,000 one-time project depending on how many sources you are stitching together. Skip it and you save money on day one, then pay for it in every "why don't these two numbers match?" meeting for the next two years.
How to actually choose
Skip the feature matrix. Answer these four questions instead:
- What warehouse or stack are you on? BigQuery pushes you toward Looker or Looker Studio. Microsoft pushes you toward Power BI. No warehouse yet? Start with Metabase or Looker Studio.
- Who builds the reports? One analyst - any tool works. Business users self-serving - lean toward ThoughtSpot or Metabase.
- How many people need governed metrics? Under 20 and informal - Power BI or Metabase. Many teams that must agree on numbers - Looker.
- What is your real budget, labor included? Be honest about the modeling work, not just the seats.
If you want a wider view of the visualization landscape before committing, our roundup of data visualization tools for 2026 covers the reporting-first options in more depth, and our marketing analytics dashboard templates show what good output actually looks like.
The bottom line
The best business intelligence tools in 2026 are the ones that fit your stack, your team, and your honest budget - not the ones with the loudest marketing. Power BI for Microsoft shops, Looker Studio for free reporting, Metabase for lean self-serve, Looker and Tableau for scale.
But the tool is the last decision, not the first. Get the data pipeline and metric modeling right and almost any of these tools will shine. Skip that work and none of them will save you.
If you would rather have the whole thing built and modeled properly the first time, our analytics and reporting team sets up the warehouse, pipelines, and dashboards as one clean system. That is the part that makes "best BI tool" a question worth answering.