A mid-market services company we talked with had done everything the buying guides told them to. They picked a well-reviewed customer satisfaction survey software, wired it to send a CSAT survey after every closed support ticket, and let it run.
Eight months later they had a dashboard full of scores. A tidy 4.3 average. Trend lines that wobbled a little and mostly held flat. And not a single decision had changed because of any of it. Nobody read the open-text comments. Detractor responses landed in an inbox no one owned. The quarterly report showed the number, someone nodded, and the meeting moved on.
That is the failure mode nobody warns you about, and it has almost nothing to do with which tool you bought. If you are evaluating survey software because you want customer feedback to actually change how you operate, the tool is the easy part. The system around it is the part that pays off, and it is the part every roundup skips. Turning scores into decisions is exactly the kind of work our analytics team builds, so this guide is about that layer, not another feature grid.
TL;DR:
- Nearly every customer satisfaction survey software can collect a clean CSAT or NPS score. That capability is commoditized.
- What separates a program that improves the business from one that just makes charts is the loop after the response: routing, follow-up, and putting scores next to revenue.
- Pricing splits into two models - per seat and per response. Pick the model that matches your volume before you compare prices.
- Choose the tool in an afternoon. Spend your real effort on the closed loop.
What customer satisfaction survey software actually does
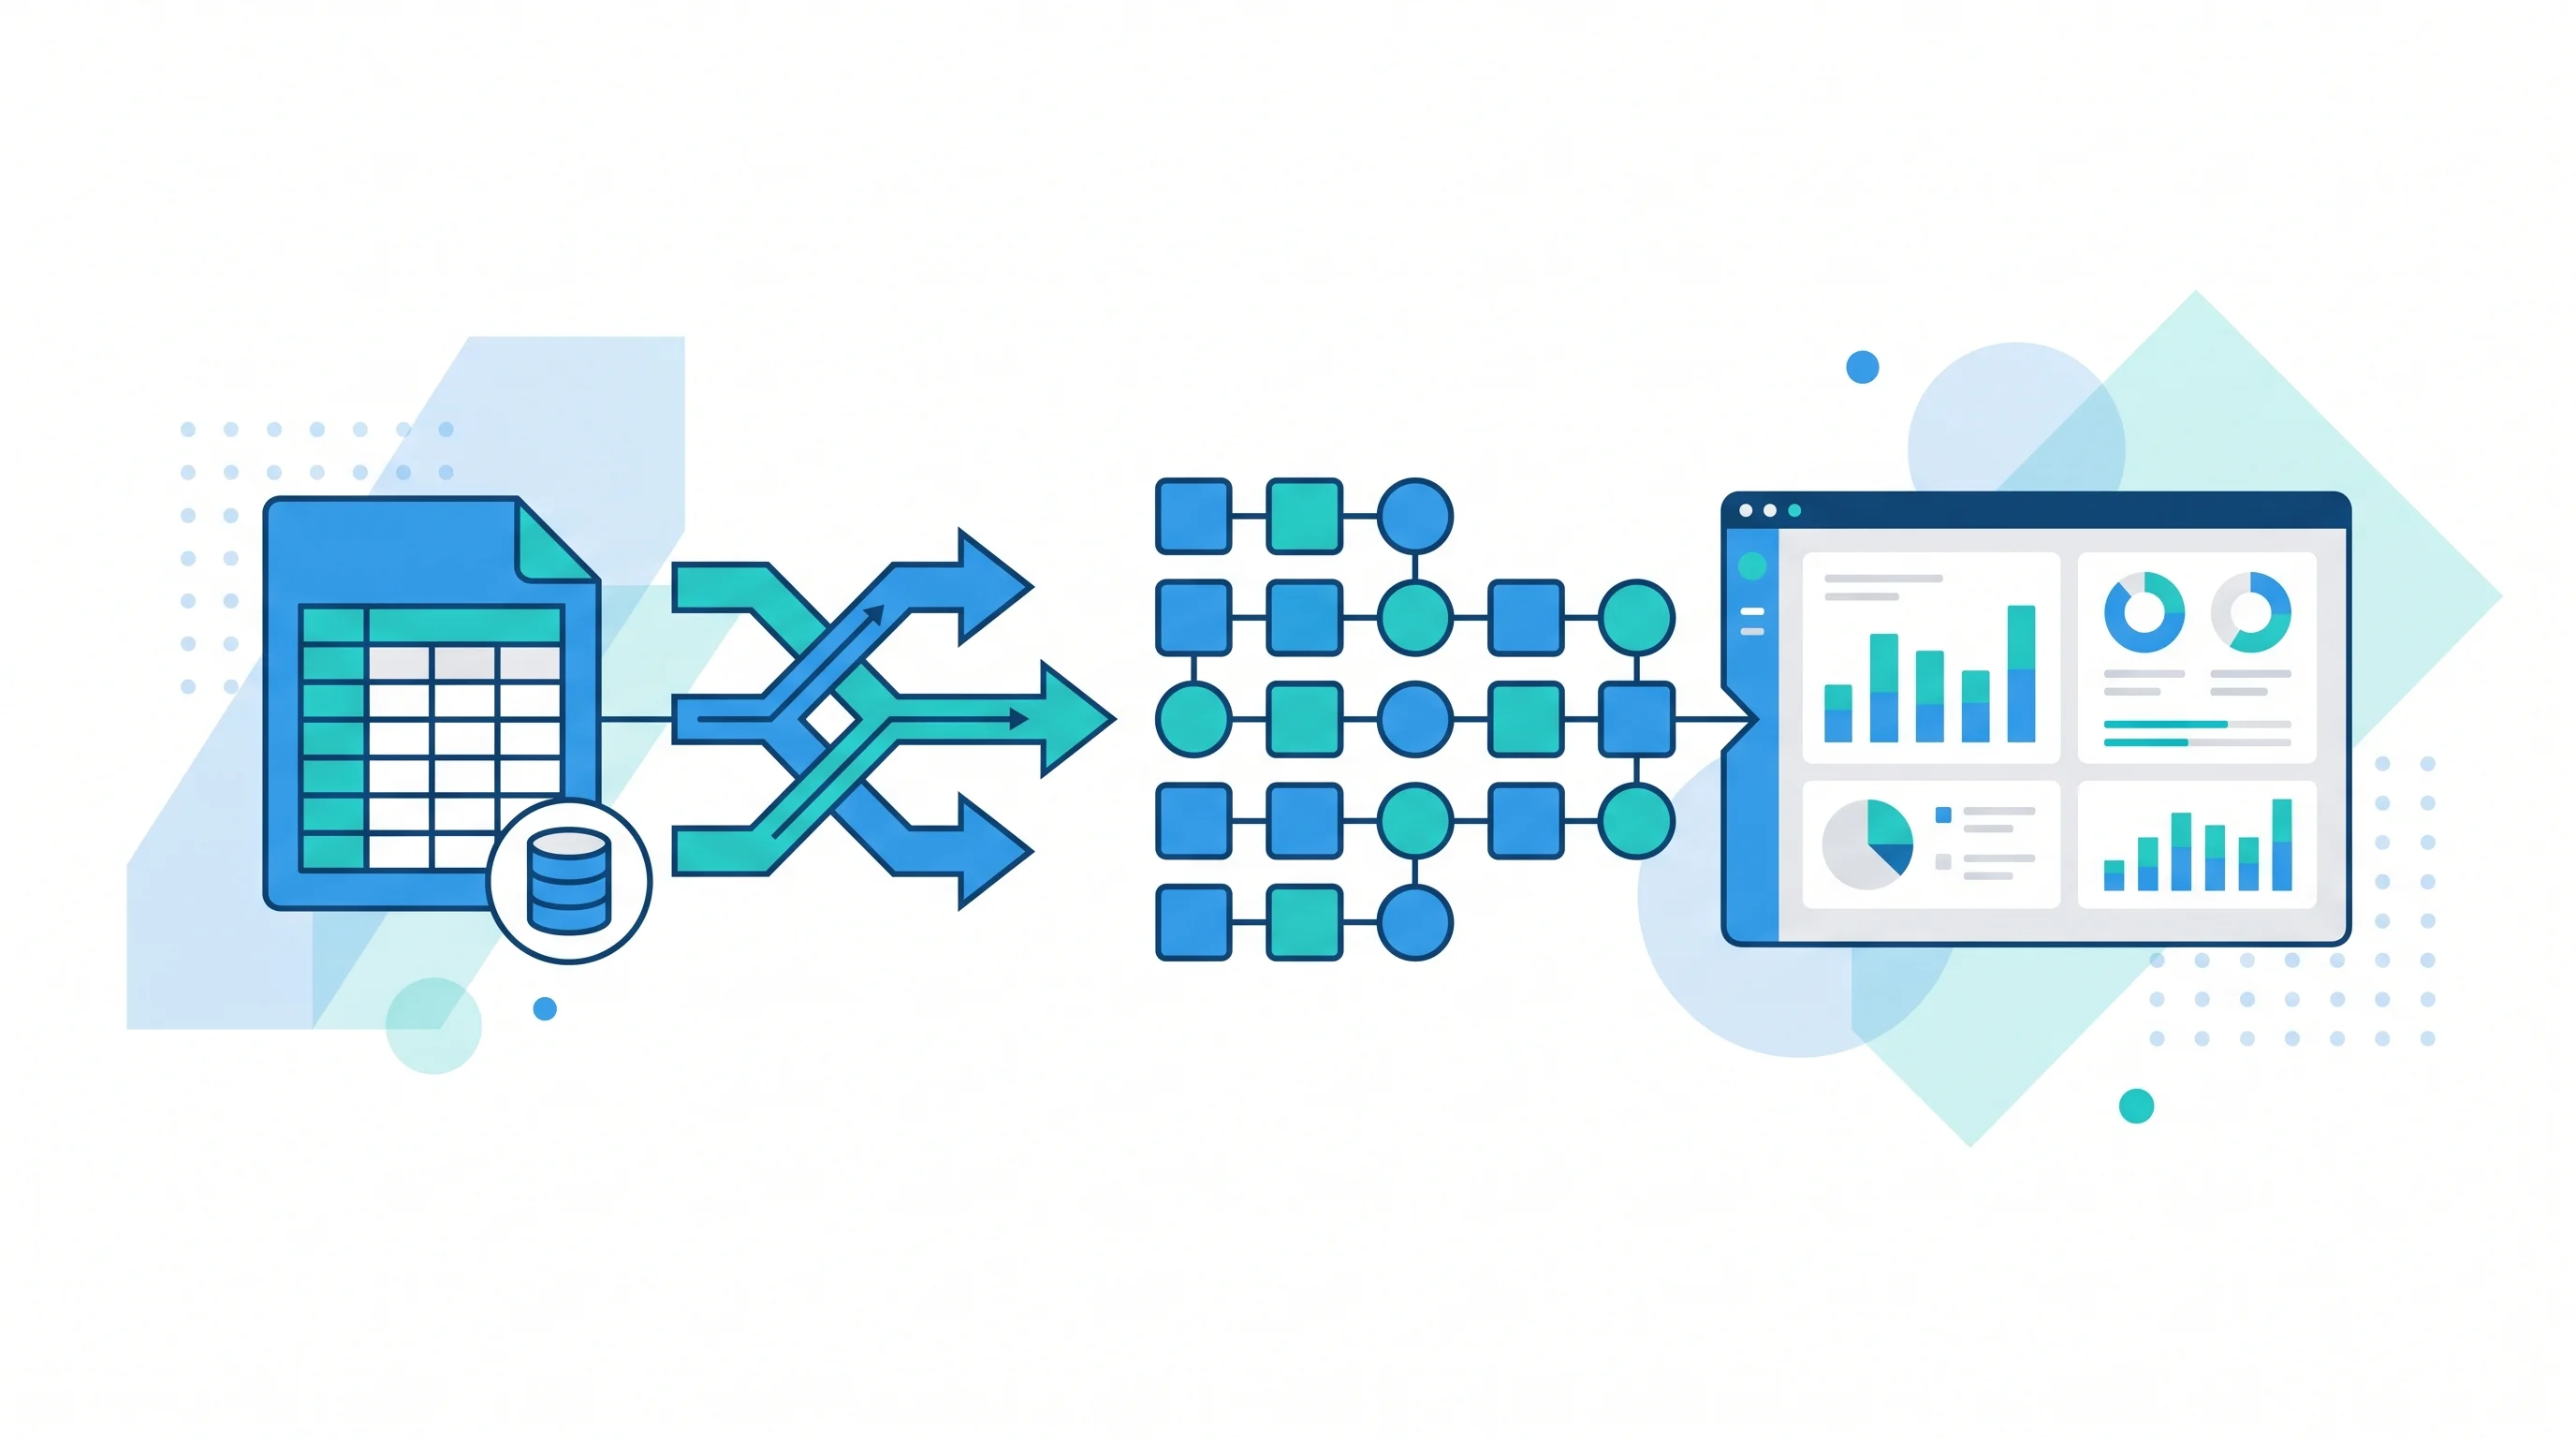
Strip away the marketing and the category does three things: it builds a survey, it delivers that survey through some channel, and it reports the results.
The surveys themselves come in a few standard shapes:
- CSAT (Customer Satisfaction) - a 1 to 5 rating tied to a specific interaction, like a support ticket or a delivery.
- NPS (Net Promoter Score) - the 0 to 10 "how likely are you to recommend us" question that tracks overall loyalty.
- CES (Customer Effort Score) - how hard it was to get something done.
Delivery is email, SMS, in-app widget, or a link. Reporting is a dashboard of averages and trends. That is the whole category, and here is the uncomfortable truth for anyone comparing options: on those three jobs, the tools have largely converged. SurveyMonkey, Survicate, Delighted, Simplesat, Zonka Feedback, Qualaroo - they will all collect a clean CSAT score and show you a trend line. The differences that fill comparison tables are real but marginal for most buyers.
The part the roundups skip: what happens after the response
Here is the question no "best customer satisfaction survey software" list answers: a customer just rated you a 2 out of 5 and typed an angry sentence. What happens in the next five minutes?
In most deployments, the honest answer is nothing. The response sits in the tool. Maybe it lowers this week's average by a hundredth of a point. The customer who took time to tell you something is wrong hears nothing back, and the person who could fix it never learns it happened.
A survey program that changes the business closes that gap. The loop has three moving parts:
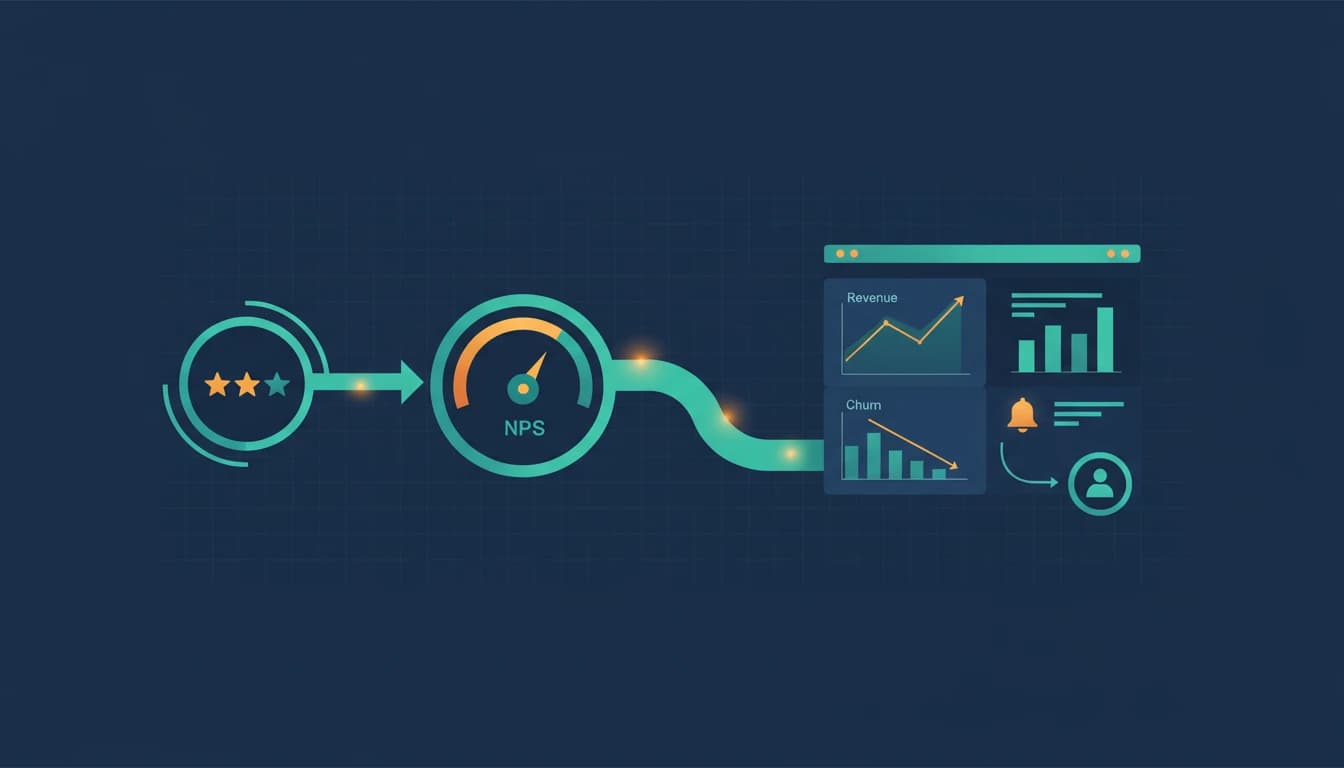
- Route it. A detractor response should immediately reach a named owner - the account manager, the support lead, someone - as a task or an alert, not a line in a weekly export.
- Act on it. Low scores trigger a follow-up: a recovery call, an apology, a fix. High scores trigger the opposite - a review request, a referral ask, an upsell moment while goodwill is high.
- Aggregate it where decisions get made. The score belongs next to revenue, churn, and support volume, not alone in a survey app nobody opens between reports.
None of that lives inside the survey tool. It lives in the connections between the survey tool, your CRM, and your reporting. That is why the tool choice is secondary: the value is created in the plumbing, and the plumbing is invisible on a pricing page. Building that detractor-to-action routing is standard work for a GoHighLevel automation setup, where the survey trigger, the alert, and the recovery sequence all live in one place.
Why this matters more than the tool: the numbers
This is not a soft "feedback is nice" argument. Bain and Company, which invented the Net Promoter Score, found that differences in relative NPS between direct competitors explain anywhere from 10 to 70 percent of the variation in their subsequent revenue growth rates. The score, when it feeds action, tracks growth.
But the phrase that matters there is "feeds action." A score that sits in a dashboard predicts nothing, because nothing downstream responds to it. The 4.3 average from our opening story was not wrong. It was just inert. The company had bought the measurement and skipped the system, which is the most common and most expensive mistake in this category.
How to actually evaluate customer satisfaction survey software
Since the survey mechanics are commoditized, evaluate on the things that determine whether you can build the loop:
Integrations, first and above all. Does it push responses into your CRM cleanly, and can a low score fire a webhook or trigger an automation? A tool that only exports a CSV has already lost, no matter how pretty its dashboard is.
Trigger flexibility. Can the survey fire automatically off a real event - ticket closed, order delivered, subscription renewed - rather than a manual blast? Automated triggers are what make the response timely enough to act on.
Response-level access, not just aggregates. You need the individual angry comment, in real time, not a monthly rollup. If the tool hides raw responses behind a higher tier, factor that in.
Open-text handling. The comments hold the "why." Tools that categorize or tag free text - increasingly with AI - save hours of manual reading. If yours does not, an AI automation layer can classify and route open-text feedback before a human ever sees it.
Pricing: the two models, and which one bites you
Sticker prices in this category mislead because they come from two different billing models. Match the model to your shape before you compare numbers.
| Billing model | You pay by | Bites when |
|---|---|---|
| Per seat | Number of users | You have many internal viewers |
| Per response | Survey submissions | You collect high volume |
Real examples make the split concrete. SurveyMonkey's team plans bill per user, with a three-user minimum and per-seat pricing that runs roughly 30 to 75 per user per month. Simplesat, aimed at support teams, bills by response instead: its Standard plan is 119 dollars a month for 1,000 responses, scaling to 499 dollars for 7,000, and explicitly notes you are billed only when a customer submits feedback, not by team size.
The lesson is not "one is cheaper." It is that a per-seat tool is cheap for a low-volume, many-viewers team and expensive for a high-volume one, and the response-based tool does the reverse. As an illustration, a support team collecting 6,000 responses a month but with only two internal viewers would pay far less on a per-seat plan than a response-based one - and a five-person analytics team collecting 400 responses would find the opposite. Do that arithmetic with your own numbers before the demo, not after.
The build: turning scores into something that acts
Once you accept that the tool is the cheap part, the project changes shape. You are no longer shopping - you are designing a small system. It has four pieces:
- The trigger - the event that sends the survey, wired to your CRM or ticketing system so it fires automatically.
- The router - the logic that sends a detractor to an owner and a promoter to a review or referral ask.
- The store - one place where every response lands, tagged and timestamped, alongside the customer record.
- The dashboard - CSAT and NPS shown next to revenue, churn, and support load, so the score informs decisions instead of decorating a slide.
The survey software is one component in that list, and honestly the most replaceable one. The other three are where a customer feedback program either earns its keep or quietly becomes the inert 4.3 nobody acts on. If you would rather have that whole loop - trigger, routing, store, and dashboard - designed and connected around whichever survey tool you pick, that is the exact engagement our analytics team scopes, and it pairs naturally with the score-to-dashboard work in our KPI dashboard examples and the review-request automations from our guide to reputation management software.
Your next step
Do not open a comparison table yet. Before you shortlist a single customer satisfaction survey software, draw the path one low score should travel.
Take a real scenario - a customer rates a support ticket 2 out of 5 at 2pm on a Tuesday. Write down, step by step, who should learn about it, how fast, what they should do, and where that score should end up so it shows up in next month's numbers. Mark every step that currently would not happen automatically.
That map is your real requirements document. The survey tool you eventually pick just has to feed it. Get the map right and almost any tool in the category will do; skip the map and the best-reviewed tool on the market will still leave you eight months from now with a tidy average and nothing changed. When you want that map turned into a working system rather than a wish list, that is what we build.